[Exploit development] 02- Deep Dive into Stack Memory Structures and Execution Semantics
Intro
Hello everyone, I hope you are well. In this article, we will discuss the stack, why any computer program needs it, what vital role it plays, and how it works in detail. We will explore the operations performed on the stack and how they are handled. Understanding the stack will pave the way for us in the exploit development field and other fields like reverse engineering and malware development.
Overview
Any computer program to accomplish its task needs some resources such as memory for storing and manipulating some data at runtime, CPU time for executing its logic, and IO interfaces to interact with for retrieving data from devices such as mouse and keyboard and export data to them, etc. These program’s requirements are controlled and managed by the Operating System itself, and the program is relieved of the trouble of dealing with them itself. That provides ease and simplicity and protects the system from many risks. However, the program must be careful and intelligent when interacting and dealing with those components. When a computer program takes time to execute on the central process unit, it must cooperate in some way with the CPU and provide it with the data required to perform operations on it. It must also have a dedicated memory to store the outputs without conflicting with other data or losing anything. The operating system provides programs with the memory they need. However, the OS does not care how that memory gets managed later. That leaves the responsibility of managing local memory to the programs themselves. What we are discussing reinforces the need for a method or mechanism to dynamically manage data in temporary memory and makes interaction with the CPU easier and more effective.
What is Stack?
When you think about how any computer program executes its logic, you’ll find that there is a root function that calls other functions, and other functions call other functions, like a tree. It is never possible for a parent function to end before the child one because every child function is considered an integral part of the parent one. For this reason, a parent function can’t end before the child one because it actually depends on the result of the child function. For example, in the C language, execution begins with the main function, and this main function calls sub-functions. The sub-functions call others until everyone finishes their task, and the main function finishes last. Isn’t this a last-in-first-out (LIFO) concept?
The stack is a temporary memory that behaves as a first-in-last-out buffer, divided into a group of frames on top of each other. Each stack frame stores data such as parameters, local variables, and other temporary things for a particular function. You can imagine the stack as an array, but the insertion is done in reverse order. That means the first frame will be at the last position, and the next one will be before it and keep growing backward. The stack size needed by the program is calculated by the compiler at compile time depending on the requirements of the program, the size of its temporary data, and the operations it performs. There are two very important elements that you should know, which are base pointer (BP) and stack pointer (SP), as the CPU relies heavily on them to access the data required to perform operations on it.
The base pointer (BP)
The stack base pointer is a register that refers to the bottom of the stack frame during function calls. Which normally refers to higher addresses as it grows towards lower. When you think of the stack horizontally as an array, this register should hold the address of the end of the frame or that array item. Data inside the stack, such as local variables and function parameters, can be located and accessed by their offsets relative to the BP.
The stack pointer (SP)
The stack pointer is a register that refers to the top of the stack frame during function calls. Which normally refers to lower addresses. The SP specifies the beginning of the frame, which means the SP points to a position lower than that BP points to when you look at the stack as an array. This register is also used to locate and access the function’s data based on their offsets within the frame relative to the SP.
The stack pointer can freely move when data is dynamically pushed onto the stack. But any data stored within the stack and every push instruction executed must be accompanied by a corresponding pop-off operation. Otherwise, the program will end up crashing.
The stack frame
The stack frame is actually a small piece of memory belonging to the stack dedicated to serving a particular function, and each frame size is calculated by the compiler at compile time depending on the data contained by that particular function.
When any function gets called, a new stack frame is initialized above the caller’s stack frame or before the caller’s frame if you look at the stack horizontally as an array. This new frame is used to store the function’s data such as variables and parameters, as we said before. The BP is pushed onto the stack to save the base address of the caller’s frame for later retrieval, as well as the return address of the function which tells the CPU what next instruction to execute after the current function finishes its task. When the function completes its execution, it should return to the caller, and that new stack frame will be deleted, and both the BP and the return address will be popped off.
There is a point I want to mention here, which is that deleting a stack frame does not necessarily mean getting rid of its content. What will happen is just moving the pointers that mark the beginning and end of the frame, which are the BP and SP. That means the function’s data will remain within the stack until another new frame overwrites it.
How software deal with the stack?
Let’s write a simple C code and show you what the stack looks like and how the program handles the stack:
#include <stdio.h>

void funcX() {
    puts("Hello from funcX");
}

void funcY() {
    puts("Hello from funcY");
}

void main() {
    funcX();
    funcY();
}
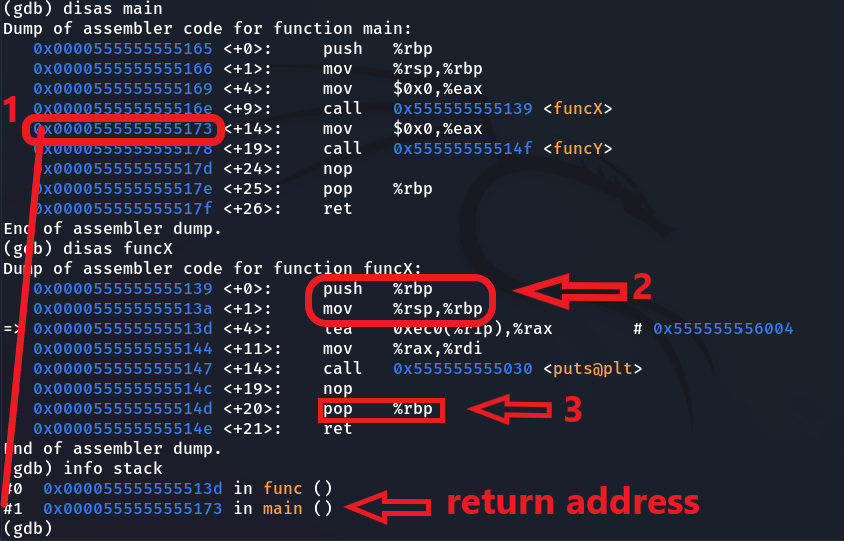
This is a simple program that has 3 functions the main function which is the entry point, funcX, funcY, both of them display a Hello message on the screen, when funcX gets called we expect that a new stack frame will be created above the main’s stack frame and both the return address and BP are pushed onto the stack, so let’s see what happens:

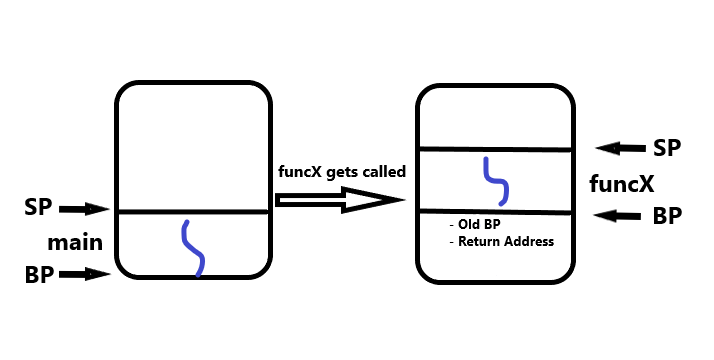
As you see in the picture when the funcX was called, following things happened.
- The function’s return address is pushed onto the stack so the CPU can remember the next instruction after calling the
funcXto resume themainfunction execution afterfuncXcompletes its execution. - The BP that marks the bottom of the main stack frame is pushed onto the stack so the program can remember it later when the function finishes. Then, the BP jumps up to the SP position, and the SP will be automatically brought up and down when temporary data is pushed and popped-off. That’s literally how a new stack frame gets initialized.
- When
funcXfinishes its execution, both BP and SP will be pointing at the bottom of thefuncX’s stack frame, which is the top of the main stack frame. So, the SP refers to the correct offset, but the BP does not. That’s why the BP had been pushed onto the stack. So, the program will pop off the BP to remember the bottom of the main stack frame. After that, the function’s return address will be popped off automatically so the CPU remembers the next instruction within the caller function to resume the execution of the main function.
After that, the execution flow will return to the main function. When the CPU pops off the instruction pointer from the stack, it will find it pointing to an instruction in the main function. The main function also contains a call to function Y. When this function gets called, a new stack frame is created in the same position as the function’s X stack frame. Then, function Y puts its own data and replaces the old data, and the same cycle that we explained previously is repeated.
Illustration showing how the stack works
This illustration demonstrates how the stack behaves with the code we explained above:

Advanced benefits of return address
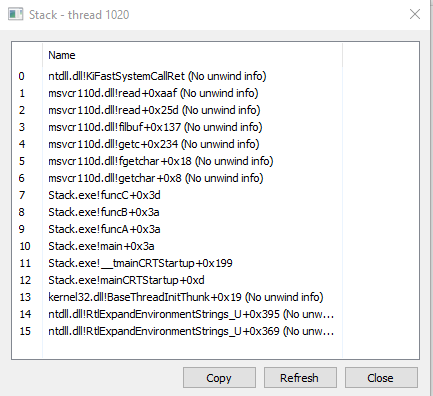
Did you ask yourself before how tools such as process hacker can track the execution of the programs and know exactly the chain of calls, How do AV/EDRs analyze the programs during execution and detect either malicious or not?
The return address is the reason, these tools grab the return addresses via walking through the stack frames, Each stack frame has a base pointer of the previous stack frame as we said before, Which makes it like a linked list data structure.
Let’s write a simple C code and show you what i mean.
#include <stdio.h>

void funcC() {
	puts("Hello from funcC");
	getchar();
}

void funcB() {
	puts("Hello from funcB");
	funcC();
}

void funcA() {
	puts("Hello from funcA");
	funcB();
}


void main()
{
	puts("Hello from main");
	funcA();
}
As you see four functions call each other as following, main->funcA->funcB->funcC, Let’s see how process hacker can track this flow.

What such programs do to track function calls is to walk through the stack frames and grab the functions’ return address, which helps in identifying who is calling whom. So let’s try to do it ourselves. First, we need to develop our assembly function that retrieves return addresses from the stack frames.
; Author => Abdallah Mohamed ( 0xNinjaCyclone )

.386
.MODEL flat, c
.code

GrabRetAddresses proc
	mov edx, [esp + 4]       ; Where the results will be stored
	mov ecx, [esp + 8]       ; Number of addresses to read
	xor eax, eax             ; bSuccess = FALSE
	mov ebx, ebp             ; BP
	grab:
	dec ecx                  ; dwSize--
	mov esi, [ebx]           ; Previous BP
	mov edi, [ebx + 4]       ; Return Address
	test esi, esi            ; We have to stop if we reach the stack base
	jz finish
	mov [edx + ecx * 4], edi ; pResult[dwSize] = pRetAddr;
	mov ebx, esi             ; Bring down to the next stack frame
	test ecx, ecx            ; Stop if we completed our task
	jnz grab
	inc eax                  ; bSuccess = TRUE
	finish:
	ret                      ; return to the caller
GrabRetAddresses endp

end
This procedure takes exactly two parameters and returns BOOL data, the first parameter is an address of an array to be filled with the return addresses, The second parameter is the number of addresses to read, it returns either TRUE on success or FALSE on failure, Now let’s modify the C application we have written to trace its execution, We will add these lines at the top:
#include <Windows.h>
#include <DbgHelp.h>

#pragma comment (lib, "DbgHelp.lib")

// Number of addresses to read
#define ADDRESSES_LENGTH 8

#ifdef __cplusplus
EXTERN_C {
#endif

extern BOOL GrabRetAddresses(LPVOID *pResult, DWORD dwSize);

#ifdef __cplusplus
}
#endif

BOOL g_bSymInitialized = FALSE;
Then, we will modify the funcC, To calls our tracing function rather than getchar:
void funcC() {
	puts("Hello from funcC");
	TraceCalls();
}
The TraceCalls function is a C function that calls the assembly procedure and prints the addresses and their relative function names on the screen. It’s a cool function and was implemented as following:
void TraceCalls() {
	PCHAR cpName;
	LPVOID lpAddresses[ADDRESSES_LENGTH] = { 0 };

	if ( ! GrabRetAddresses(lpAddresses, ADDRESSES_LENGTH) )
	{
		puts("Failed to grab ret addresses");
		return;
	}

	for(int nIdx = 0; nIdx < ADDRESSES_LENGTH; nIdx++)
	{
		printf("Return Addr = %p, Function Name = ", lpAddresses[nIdx]);

		if ( cpName = FuncNameByAddr(lpAddresses[nIdx]) )
		{
			printf("%s\n", cpName);
			free(cpName);
		} else {
			puts("UNKNOWN");
		}

	}

}
This function calls another function as you see called FuncNameByAddr which is responsible for getting the function name by its address that we get it via the assembly function GrabRetAddresses:
PCHAR FuncNameByAddr(LPVOID lpFuncAddr)
{
	PSYMBOL_INFO pSymbol;
	PCHAR cpName;
	HANDLE hCurrProc = GetCurrentProcess();
	DWORD64 dw64Displacement = 0;
	DWORD dwSize = sizeof(SYMBOL_INFO) + MAX_SYM_NAME * sizeof(TCHAR);
	DWORD dwNameSize = MAX_SYM_NAME * sizeof(TCHAR);

	if ( ! g_bSymInitialized )
	{
		if ( ! SymInitialize(hCurrProc, NULL, TRUE) )
			return NULL;

		g_bSymInitialized = TRUE;
	}

	if ( ! (pSymbol = (PSYMBOL_INFO) malloc(dwSize)) )
		return NULL;

	ZeroMemory(pSymbol, dwSize);
	pSymbol->SizeOfStruct = sizeof(SYMBOL_INFO);
	pSymbol->MaxNameLen = MAX_SYM_NAME;


	if ( ! SymFromAddr(hCurrProc, (DWORD64) lpFuncAddr, &dw64Displacement, pSymbol) )
	{
		free( pSymbol );
		return NULL;
	}

	if ( !(cpName = (PCHAR) malloc(dwNameSize)) )
	{
		free( pSymbol );
		return NULL;
	}

	UnDecorateSymbolName(pSymbol->Name, (PSTR) cpName, dwNameSize, UNDNAME_COMPLETE);
	free( pSymbol );

	return cpName;
}
This function as we said grabs the function name via its address, It is not as complicated as you imagine, first, we use SymInitialize API to initialize the symbol handler for the process, then we allocate some memory for the Symbol with a specific size, then we fill this memory with zeros and put some data needed by the API, to avoid a crash or any problem when the API uses it, after that we call the SymFromAddr and pass the function address and the symbol by reference to be written by the API, the symbol contains valuable information one of them is the function name that we search for, then we allocate some memory for the function name and grab it, and finally we deallocate the symbol and return the name to the caller which will be responsible for deallocating it.
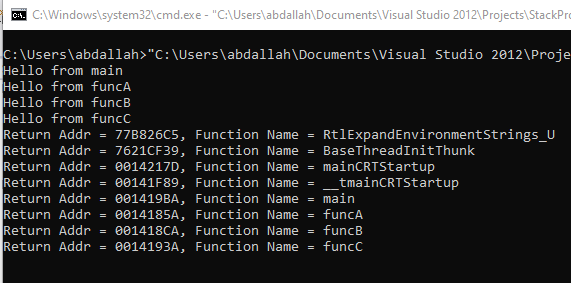
Let’s run it:

As you see we could trace the chain of function calls depending on the valuable pieces of information that we grabbed from the stack, and we will abuse these things later in Malware Development series. We will exploit this things to bypass the most advanced security tools.
Also, we can grab this information remotely from another process via APIs like StackWalk, but I wanted to show you how that can happen exactly, so that’s why I have developed our stack walker using assembly.
Conclusion
Try writing your own codes and playing with the debugger, and seeing what the stack looks like at each step, and how your code gets handled at the low level to solidify your understanding. Please don’t forget to share this article if you enjoyed it. Thank you for reading, goodbye.
